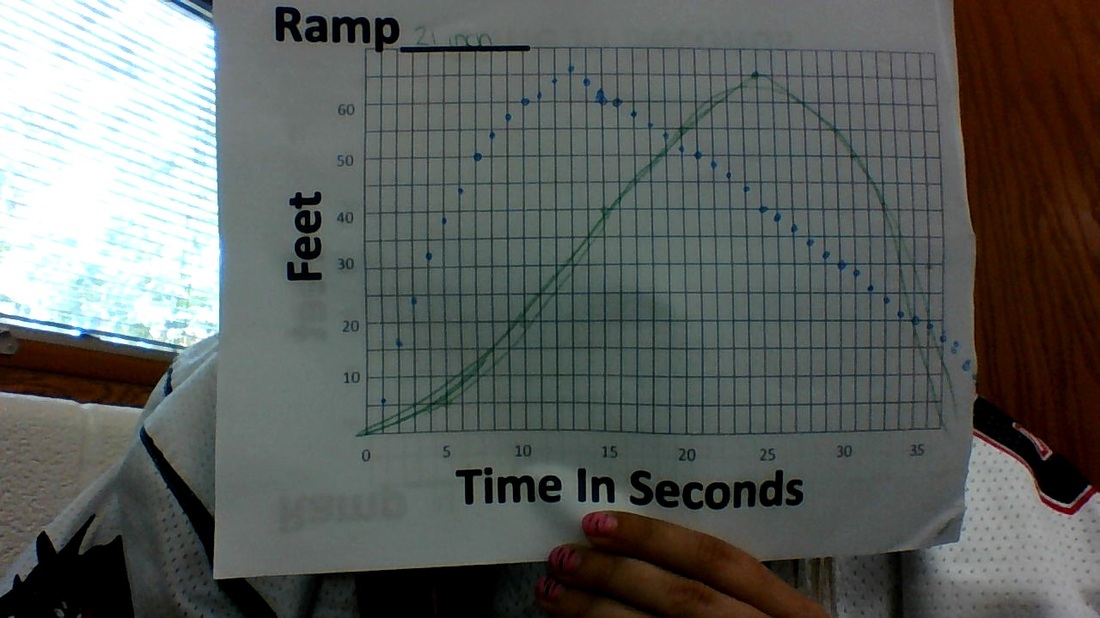
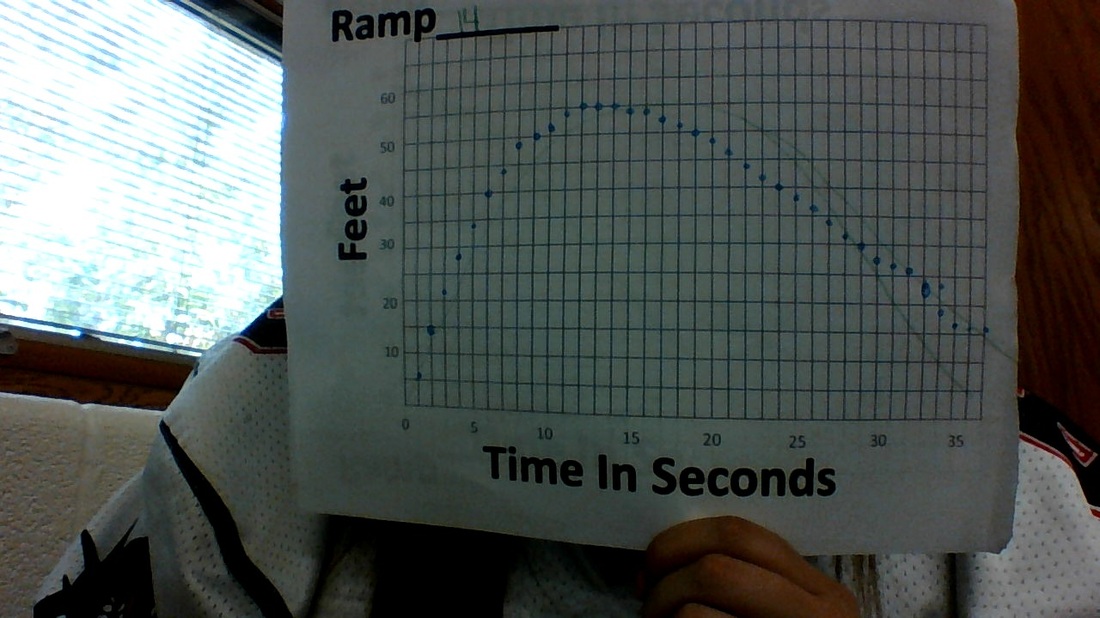
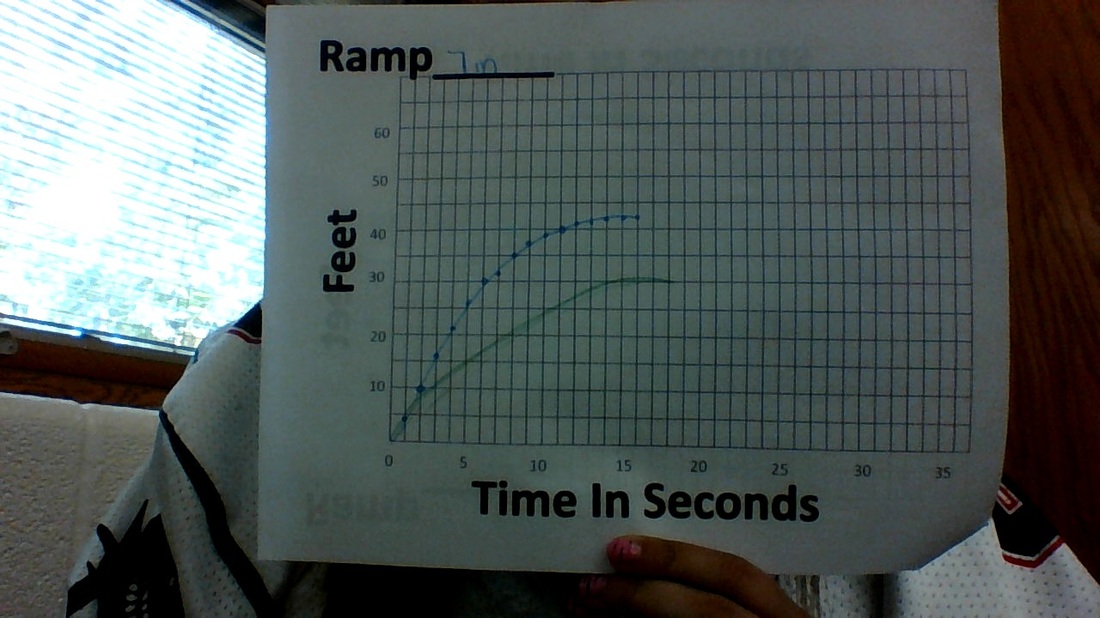
In math class, our teacher showed us a video of him pushing a skateboard down a 21 inch ramp, a 14 inch ramp, and a 7 inch ramp to see how far the skateboard went each second. In my first graph, I was way off because I predicted that the skateboard would go faster later, but it actually went faster at the beginning then slowed down. In my second graph, I was more accurate on my prediction, but I wasn't 100 percent right. I predicted that it would start off faster than slow down. The skateboard did start off faster, but a tad bit faster than my prediction. In the third graph, I predicted that the skateboard would start off fast then slow down. This was true, but it started off slow, than fast, then slowed right down again. When watching the second and third video, it makes you pay more attention so you can have a more accurate guess. The domain for the 21 inch ramp graph is [0, 36] and the range is [0,66]. The domain for the 14 inch ramp graph is [0,36]and the range is [0,55]. The domain for the 7 inch ramp graph is [0,18] and the range is [0,43]. Well when looking at these three graphs, you can see that all three of them contain a maximum. Just all three maximums are different. For example, the 21 inch ramp has the maximum of 66, the 14 inch ramp has a maximum of 55, and the 7 inch ramp has a maximum of 43. The 21 inch ramp has the highest maximum because since the ramp is elevated more, the skateboard will get more acceleration going down it. All the graphs have 0 as their minimum and each graph only has one zero each and that is because they all start at 0. The graphs are different because the skateboard starts at different elevations so the skateboard will go faster or slower. They are similar because each graph starts at the same rate or close to the same rate. They don't start slowing down or going faster until two or three seconds. The 21 inch ramp was the highest in acceleration because it had more velocity coming down the ramp, but all the graphs had the same deceleration rate because when the skateboard lost its momentum, the drive way is the same slope so they all have the same deceleration rate.
 This is my experience with different types of functions. In my picture above I got to make my own art work and combine a whole bunch of different functions together. I used absolute functions, square root functions, reciprocal functions, identify functions, sine function, etc. What I learned about functions was how to graph and move the graph up, down, right or left. For example, using the equation y=a(x+h)^2+k, as the h increases, the graph moves left or when A decreases it flips.
|
AuthorWrite something about yourself. No need to be fancy, just an overview. Archives
March 2015
Categories |
 RSS Feed
